
Infographics have become extremely popular ways to share information by presenting it in a manageable format. However, what’s the secret behind those that seem to blow up overnight, versus the infographics that may do marginally well among specific groups of people but never even come close to spreading virally on the internet?
Below, we’ll look closely at some infographics that have performed well on social media and give insight on how to make an impact on the internet.
Attention to Pop Culture
No matter what sort of infographic you’re creating, it’s often much easier to get great results if you tie your topic into something that’s currently sending everyone into a media frenzy. If you are quick to cover a timely topic, bloggers and journalists will turn to you to provide visuals for their coverage of an event or story. This is true regardless of whether the niche you cover is current events, or entertainment, or even marketing. Timely stuff works.

Clarity Way, a holistic rehab center, jumped on a rising trend when it created a Breaking Bad themed infographic that speculated about the various persons or factors that could cause the show’s lead character, Walter White, to finally meet his downfall.
The infographic went viral on Facebook and StumbleUpon, netting 1.3 thousand likes on Facebook and over 3 thousand upvotes on StumbleUpon. It has gotten renewed interest since then, as new episodes aired and the show came to a close.
Clarity Way is no stranger to jumping on trends – it produced an infographic about child celebrities and their tendencies toward addiction when Amanda Bynes started making headlines for her risqué tweets and brushes with the law. It also released a video comparing bath salts addicts to zombies soon after a face-eating drug addict shot the street drug to infamy.
Obviously, to capitalize on these trends, companies need to keep a close watch on the news (a Google Alert set to certain key terms related to your business may help) and a trigger finger for creating infographics around these topics quickly. The reward for this can be huge though – the aforementioned zombie video made it to the Huffington Post.
Creation of Trust for Users
Infographics are often used to sell something, but even more often they tend towards tangentially related topics that the company believes will have more popular appeal. Companies that approach their topics creatively are able to carefully make the sale an essential part of the piece, all while encouraging readers to feel a greater sense of trust.

Mosquito Magnet, a pest control company, made a successful infographic about mosquitoes that educated people and promoted their mosquito-destroying product while helping them have fun. Participants debunked myths and learned more about what attracts and repels the pesky insects.
At the bottom of the infographic, the company clearly listed source material, allowing interested persons to quickly verify truthfulness. The bottom corner also features the company’s logo, not to mention the fact that the company’s name is in the name of the infographic. Together, these components work to showcase Mosquito Magnet as a reliable source of information, as well as a provider of products that combat mosquitoes.
The infographic has received thousands of pins and StumbleUpon upvotes, and it has been featured on successful blogs like BuzzFeed. Because it features evergreen information, the company can feel confident about using it on a long-term basis. Extremely brand-centric infographics don’t often succeed (unless your brand is, say, Google), but this example is living proof that with the right product and approach, they can.
Knowledge of What Interests Your Audience
Because there are so many different directions in which you could take an infographic idea, it’s important to stay focused as much as possible by considering the methods of delivery that will inspire your audience the most.
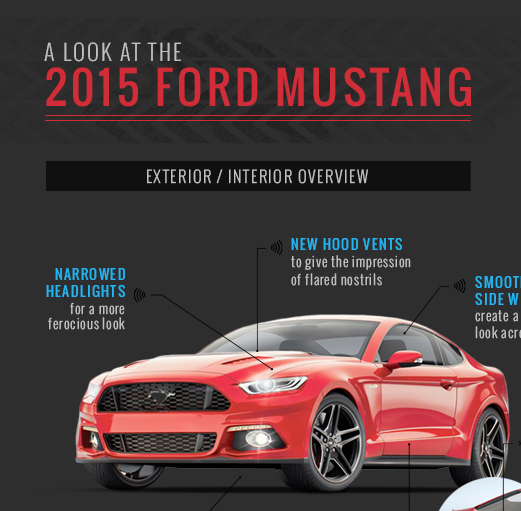
CJ Pony Parts, a retailer that caters to Ford Mustang owners, showed impressive foresight by building an infographic to get its target audience excited about the upcoming 2015 Mustang. Instead of just dryly mentioning statistics and leaving readers to draw their own conclusions, the creators made comparisons, such as how the car’s top speed will be equivalent to a Boeing 737 on takeoff or how it will have enough power to tow five baby elephants.
The infographic also goes into depth about some notable features of the 2015 Mustang, to clarify what makes this vehicle different from past models. Depending on what you’re selling, the target audience may not always be lured by information that’s presented visually, but car enthusiasts are known for attending showcases, purchasing glossy magazines and eagerly browsing the Internet for the newest snapshot of their dream cars.
Unsurprisingly, the CJ Pony Parts infographic performed well with car lovers and attracted attention from big car publications like Autoweek. That’s likely because the people behind it knew how to resonate with their target audience.
To use the same technique to your advantage, create a profile of your ideal customer. How do they look for information before making a purchase? What motivates them? What do they just think is really cool? Viral infographics that are popular with the internet large are great in their own right, but if the ultimate goal is increasing your bottom line, you want your infographic to go viral with the people most likely to buy your product or service.
In CJ Pony’s case, that is classic car enthusiasts, people who own old Mustangs, or even have a few “project” cars on the backburner. What does your target audience love?
Why Does It Matter?
According to the Visual Teaching Alliance, the human brain processes visual information 60,000 times faster than text input, and about 90 percent of the information that reaches the brain is of a visual variety. Even if you take time to create something that looks slick, it’s equally important to combine it with verifiable data.
Graphics with popular appeal are always going to be more likely to go viral than those that fall into a niche category. That’s why the Breaking Bad infographic can get thousands of shares, while an infographic about the rehab industry might only net Clarity Way a few hundred shares. While the second would still be highly relevant to their industry, only the first resonates with literally anyone who watches Breaking Bad. Ultimately, though, it’s about your goals – a widely viral infographic is great for branding and recognition, while a targeted graphic is great for getting more sales.
By keeping these ideals in mind and also being aware of the case studies examined above, you’ll be well on your way to creating a cool and worthwhile infographic that could become very well known in a short span of time. Good luck!
Pingback: Terrific new online tools for PR prosCloud0086 Latest Tech News | Cloud0086 Latest Tech News
Pingback: Cleaning Up When Your Stolen Infographic Goes Viral | Bikini Marketing
Pingback: Cleaning Up When Your Stolen Infographic Goes Viral | Teresita Gesell
Pingback: 5 Marketing Tactics That Will Push Your Small Business Ahead in 2015 | The Business Hippy
Some infographics really lend themselves to virility. The best I’ve ever seen was Incapsula’s 2014 Bot Traffic Report.
I immediately recognized that each section was the perfect size for an image to promote the entire infographic - but from a unique angle each time. If you look at my @GrowMap Twitter account you’ll see that I tweeted every single smaller image over a few days to maximize interest in their post and infographic. I don’t know who made it, but they knew what they were doing.
Very true, Gail! Thanks for sharing!!